Monitoring and Upgrading VPS Resources
Keeping an eye on your VPS's CPU, RAM, and disk usage helps you catch performance problems early and plan capacity upgrades before users are affected. This guide covers the essential Linux monitoring commands and explains how to upgrade your CyclebreezeHost VPS plan when you need more resources.
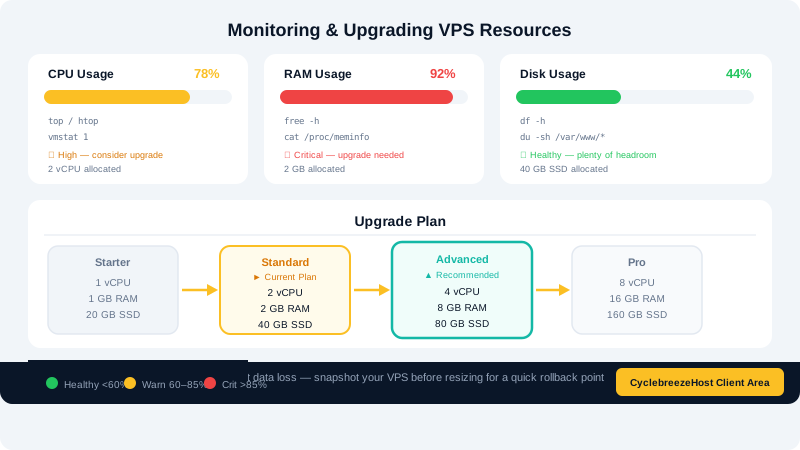
Checking Resource Usage from the Command Line
CPU and Memory — top and htop
The top command gives a live, updating view of CPU and memory usage:
top
Key columns to watch:
- %CPU — CPU usage per process.
- %MEM — Memory usage per process.
- load average (top right) — 1, 5, and 15-minute averages. A load average above your number of CPU cores consistently indicates saturation.
htop is a more readable alternative. Install it if it is not already present:
apt install htop -y    # Ubuntu/Debian
dnf install htop -y   # AlmaLinux
htop
Press F10 or q to exit.
Memory — free
For a quick snapshot of RAM and swap usage:
free -h
The -h flag displays values in human-readable units (GB/MB). Focus on the available column under Mem — this is the memory your server can allocate to new processes without swapping.
Disk Space — df
df -h
This shows disk usage for every mounted filesystem. Watch the Use% column for your root partition (/). If it exceeds 85–90%, free up space or consider a disk upgrade.
Disk I/O — iostat
Install the sysstat package for I/O statistics:
apt install sysstat -y    # Ubuntu/Debian
dnf install sysstat -y   # AlmaLinux
iostat -x 2 5
This runs five readings, two seconds apart. A consistently high %util value (close to 100%) for a disk suggests I/O is a bottleneck.
Network Usage — vnstat
apt install vnstat -y
vnstat -l
vnstat -l shows live traffic. vnstat -d shows daily totals. Useful for spotting unexpected bandwidth spikes.
Identifying Resource-Heavy Processes
To find which process is consuming the most CPU:
ps aux --sort=-%cpu | head -10
To find the top memory consumers:
ps aux --sort=-%mem | head -10
Monitoring with a Dashboard
For ongoing visibility without staying logged in, consider installing a lightweight monitoring agent:
- Netdata — installs in one command and provides a real-time dashboard at
http://your-server-ip:19999. - Glances — terminal-based overview of all resources in one screen (
pip3 install glances).
Upgrading Your VPS Plan
When monitoring shows that your current plan is consistently under strain, upgrading through the Client Area is straightforward.
- Log in to the Client Area at https://clients.cyclebreezehost.com.
- Navigate to Services and click on your VPS.
- Select Upgrade/Downgrade from the service actions menu.
- Choose a higher plan with the CPU cores, RAM, and storage you need.
- Review the prorated cost and confirm the upgrade.
CyclebreezeHost Cloud VPS upgrades are provisioned on the same underlying infrastructure, so your IP address, data, and configuration are preserved. In most cases the server requires a brief reboot to apply the new resource allocation.
Expanding Disk Space
If you need more disk without upgrading the full plan:
- Check whether an unallocated disk extension is available in your plan's upgrade options.
- After resizing, you may need to extend the filesystem. For ext4:
For XFS:resize2fs /dev/sda1xfs_growfs /
Always take a snapshot backup (available from the server control panel in the Client Area) before resizing partitions.
Setting Up Alerts
Rather than checking manually, configure email alerts for high resource usage. Tools like monit can watch thresholds and notify you:
apt install monit -y
Edit /etc/monit/monitrc to add CPU, memory, and disk checks with alert email addresses.
Getting Help
If your server is under unexpected load or you are unsure which plan is right for your workload, contact CyclebreezeHost support at info@cyclebreezehost.com or open a ticket in the Client Area at https://clients.cyclebreezehost.com. Our team is available 24/7.